 Agency Statistical Consulting
Recall from Part 1 of "The language of statistics" that the goal of research is to understand how some phenomenon or relationship in the world works, but that the researcher can only study a sample of the population they are interested in and wish to say something about. Generically, one might call the elements of the sample--whether people, patients, planets, fish, or whatever--subjects.
Researchers can measure various things about the subjects; these measurements are data. Based on these data, one can:
So how do you calculate an estimate? By following a procedure called an estimator. An estimator is the recipe; an estimate is one cake made by following that recipe one time. The ingredients, from the flour and eggs right down to the electricity for the oven, are the sample of data.
Here is a commonly-used estimator: "Add up the values measured from each subject in your sample, then divide that by the number of subjects in the sample." This is the recipe---the procedure in words---for calculating the sample mean, which is an estimate of the population mean (which, as you'll recall, you can never really know for certain.) That procedure can be written more succinctly with a mathematical formula.
(Or why a cake always differs a bit from what you'd expect based on the recipe.)
We have all experienced cakes that did not come out quite as expected, even though we followed a tried and true recipe. Maybe we use a certain recipe ten times, and get a pretty good cake each time, but some are a tad drier than others, or a tad sweeter. How does that happen? And then one day, maybe your 11th cake with this recipe turns out awful. How does that happen? Well maybe, unbeknownst to you, the atmospheric pressure was a little different, or the relative humidity, or the batch of flour your bag came from was handled differently in the factory, or you put the pan in a slightly different place inside the oven. Maybe you even got distracted and forgot to add an ingredient! Things happen.
So even if you follow what you believe is a good, reliable recipe, you'll get different results each time---usually just slightly different, but once in a while way off. This is called sampling variation. True, you used the same ingredients each time, but not exactly the same: once you throw one cup of flour into a bowl of cake batter, you can never use those particular grains of flour again for another cake. So you are using a different sample of ingredients for each cake.
Same thing in research. You gather a sample of the fish or people or planets or patients that you are studying, measure something about each one, plug all those measurements (your data) into your estimator (your procedure), and out comes your estimate. But if you tried the whole thing again---gather a new sample, make new measurements, run your estimator, and produce an estimate---you would likely get a different estimate. That's sampling variation, and it is crucial to understanding statistics.
This is another reason that an estimate might be "off" from the parameter that it represents. What I've called it, "natural variation," may not be the name everyone uses, but the idea is that some things in nature are just inherently more variable than others. For example, arterial blood pH is confined to a much narrower range than serum cholesterol concentration. The latter varies more than the former. In our baking analogy, wild berries probably vary more in size, color, and sweetness than commercially-grown, farmed berries. So if you bake cakes using the former, the results might vary more than if you used the latter.
Another important part of statistics is to understand the reasons behind what I'm calling "natural variation." Here's an example in a graph:
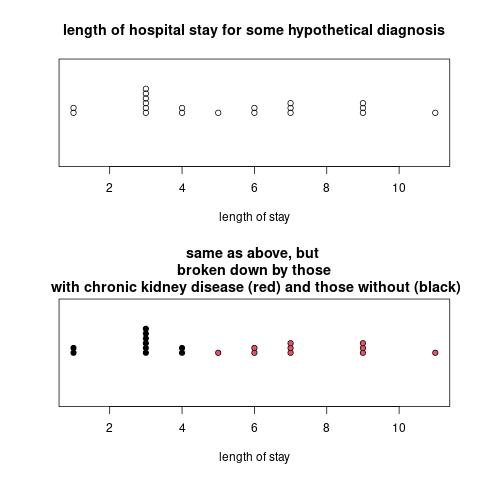
At first glance, in the top graph, the length of hospital stay (LOS) for these hypothetical patients varies quite a bit. But by breaking them down by which subjects have chronic kidney disease and which don't, we understand more about the variation in LOS, and we see that within group, the variation is smaller.
Some variation arises because measurement methods or instruments are imprecise or sloppily used. The quantity of flour used to bake a cake, for example, is more precisely measured with a food scale than with measuring cups---the amount of flour in a measuring cup depends a lot on how tightly you pack it.
An important part of statistics is understanding, explaining, and quantifying variation in the data. Some variation we want to reduce. Like using data collection procedures that are as precise as possible, to minimize measurement error. Or by using larger sample sizes to minimize sampling variation (more cakes!). And we want to quantify sampling variation so we can say how far "off" from reality our conclusiong could be. Other types of variation are scientifically or operationally interesting, and we want to explore these, perhaps by measuring other things about our subjects too.